Tutorial
Shapley Value aided Recipe for Materials Design
Read SHAP plots for electrical and thermal conductivity, and use model explanations to guide further study.
Explore at your own pace
Work through the examples in small steps. Try the tools, inspect the results and run the code.
Tutorial
Read SHAP plots for electrical and thermal conductivity, and use model explanations to guide further study.
Tutorial
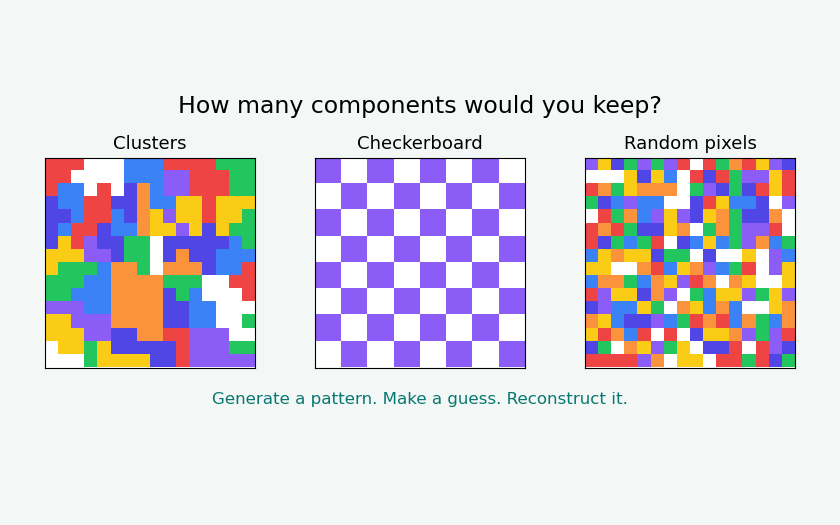
Generate colored patterns, guess the component count, then watch PCA reconstruct the image.
Tutorial
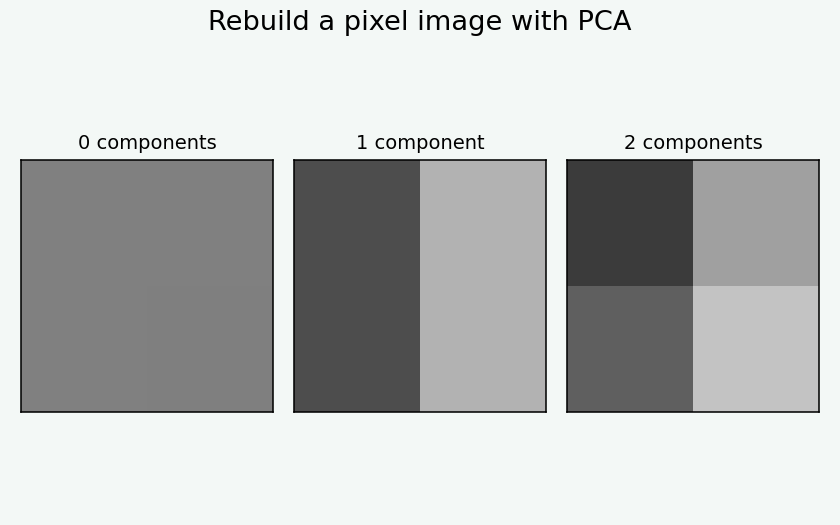
Follow the pixel values through centering, principal components and reconstruction. Run the notebook in small steps.
Tutorial
Create circles and periodic patterns with NumPy, then inspect their Fourier transforms.
Tutorial
Try image filtering and compare the results.
Tutorial
Examine feature contributions in models with multiple outputs.
Tutorial
Build a convolutional neural network for microstructure images.
Tutorial
Examine how the choices in a convolutional network affect its structure.
Tutorial
Display relationships in data with a heatmap.
Tutorial
Compare predictions and observations using regression metrics.
Tutorial
Extend regression to several input features.
Tutorial
Build a dataset whose underlying relationships are known.
Tutorial
Use logistic regression to distinguish two classes.
Tutorial
Work with classes that have a meaningful order.
Tutorial
Count correct and incorrect classifications and interpret the metrics.
Tutorial
Measure spatial relationships in simulated images and micrographs.
No matching topics. Try another word or clear the search.
I use Python in these tutorials. If you are starting out, Google Colab is a convenient way to run the examples. If you prefer to work on your own computer, use Jupyter Notebook.
I suggest building a program in small parts. First decide what you want it to do and write the steps in ordinary language. For an image example, these steps might be: create an array, change some pixel values, and display the image. Write a few lines for the first step, run them, and check the output before adding the next step.
Here I create a 4 × 4 image. Its values are dimensionless: 0 is the background and 1 marks a selected pixel. Run the cells below in order.
Cell 1: Create the array and inspect it. The shape should be (4, 4), and all 16 entries should be zero.
import numpy as np
import matplotlib.pyplot as plt

image = np.zeros((4, 4))
print(image.shape)
print(image)
Cell 2: Change the four central pixels. The slice 1:3 selects indices 1 and 2; the end index 3 is excluded. The sum should be 4 and the mean should be 0.25. An assert statement checks a condition and reports an error if it is false.
image[1:3, 1:3] = 1
print(image)
print("Sum:", image.sum())
print("Mean:", image.mean())
assert image.sum() == 4
Cell 3: Display the image. You should see a white 2 × 2 square in a black background. Try changing one pixel and compare the displayed image with the printed array.
plt.imshow(image, cmap="gray", vmin=0, vmax=1,
           interpolation="nearest")
plt.xlabel("Column index")
plt.ylabel("Row index")
plt.xticks(range(4))
plt.yticks(range(4))
plt.show()Read the last line of the error message first. It usually names the error and gives a short description. Then look at the highlighted line in your code. Check spelling, indentation, variable names, array dimensions, and file locations. If a name is not defined, check whether you ran the cell that creates it. If a library cannot be imported, check that it is installed in the Python environment you are using.
Try to explain the problem and make a small correction yourself before asking for a complete replacement program. Print the relevant values or reduce the code to a few lines that still produce the error. This helps you understand the cause.
In Colab, you can also ask its AI assistant to explain an error. If an “Explain error” option is available, use it, or ask in the AI chat. For example: “Explain this error in simple terms. Which line causes it? Give me a hint before suggesting a fix.” Read the explanation, check the suggested change, and rerun your small test. A suggested fix still needs to produce the result you expect. See Colab’s guidance on its AI features.
When the notebook works, restart its kernel or runtime and run all cells from the beginning. This checks that the result does not depend on a variable left over from an earlier attempt. Save the notebook with a clear name.
An IDE, or integrated development environment, brings together tools for writing, running, and debugging code. Visual Studio Code with its Python extension is one option. You can keep related files in a project folder, save a program as a .py file, and use the debugger to pause at a line and inspect variable values. Make sure the selected Python interpreter is the environment where you installed the required libraries. Follow the VS Code Python tutorial for setup and a first program.